
week of 10-11.jpg
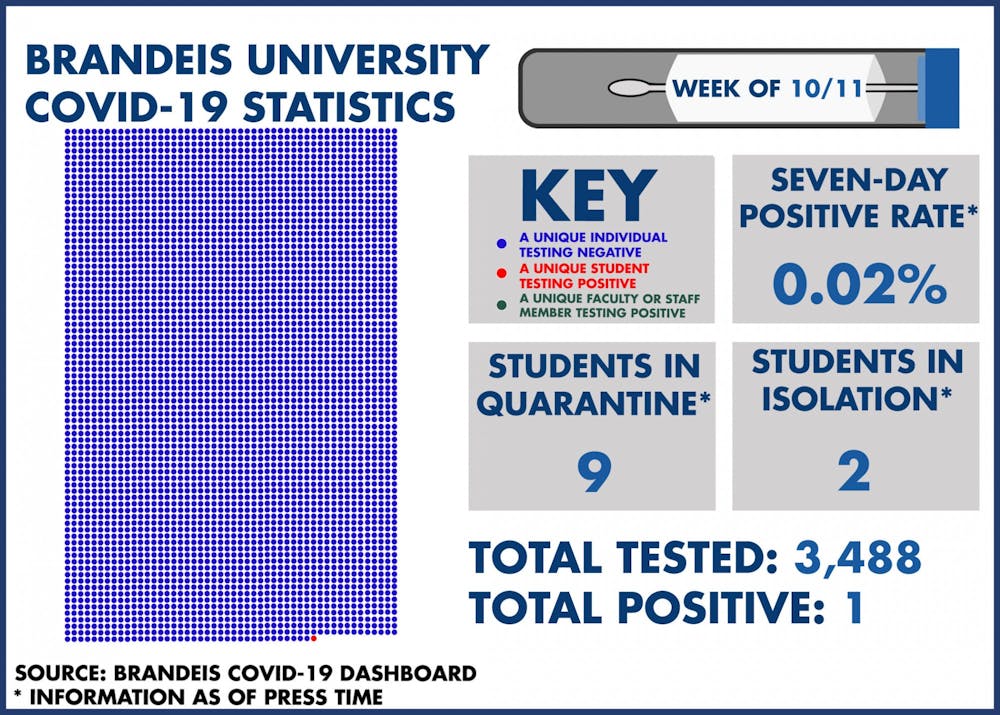
Brandeis University is keeping the community informed about its COVID-19 statistics through an online dashboard. This dashboard contains information about how many tests were collected, how many individuals were tested, how many individuals tested positive, how many students are in quarantine, how many students are in isolation and the seven-day average for positive tests on campus. The dashboard also includes various statistics about areas in Massachusetts. The Justice will produce infographics each week, visually displaying the information that the University releases online.

Trouble in Paradise: Sense and Sensibility’s Virtues and Theater Sins
Growing uncertainty about East Quad's future raises speculation
Atlanta Hawks’ strip club-themed promotional night receives pushback from players
Eduroam connectivity issues disrupt students during the midterm season
“Resident Evil 9: Requiem,” recontextualizing a golden formula