
infographic web 8-30.jpg
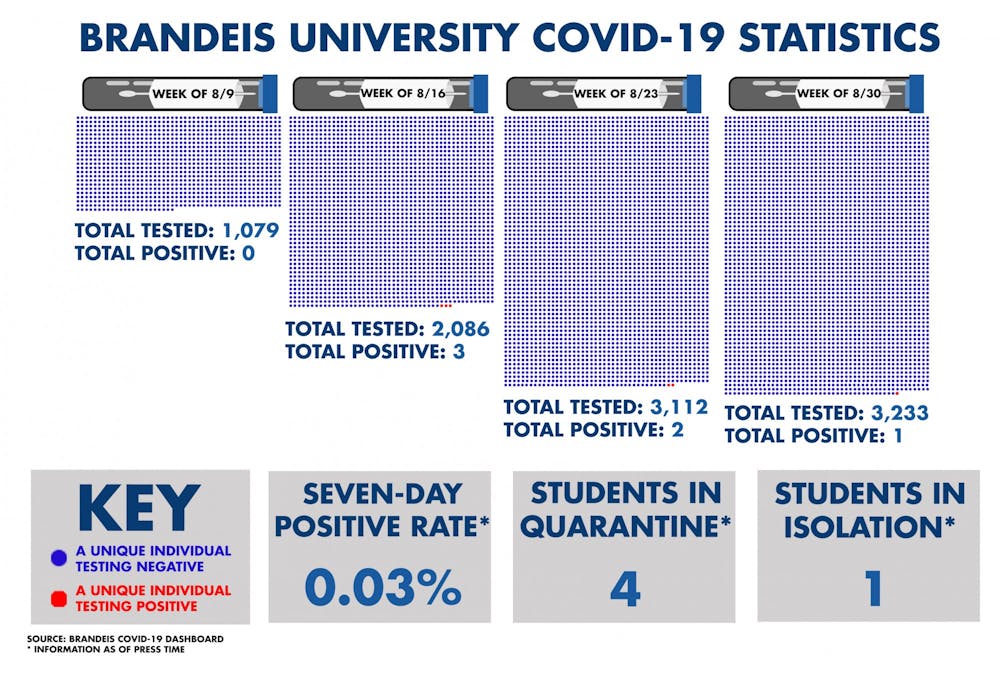
Brandeis University is keeping the community informed about its COVID-19 statistics through an online dashboard. This dashboard contains information about how many tests were collected, how many individuals were tested, how many individuals tested positive, how many students are in quarantine, how many students are in isolation and the seven-day average for positive tests on campus. The dashboard also includes various statistics about areas in Massachusetts. The Justice will produce infographics each week, visually displaying the information that the University releases online.

Enacting democracy in an age of suppression